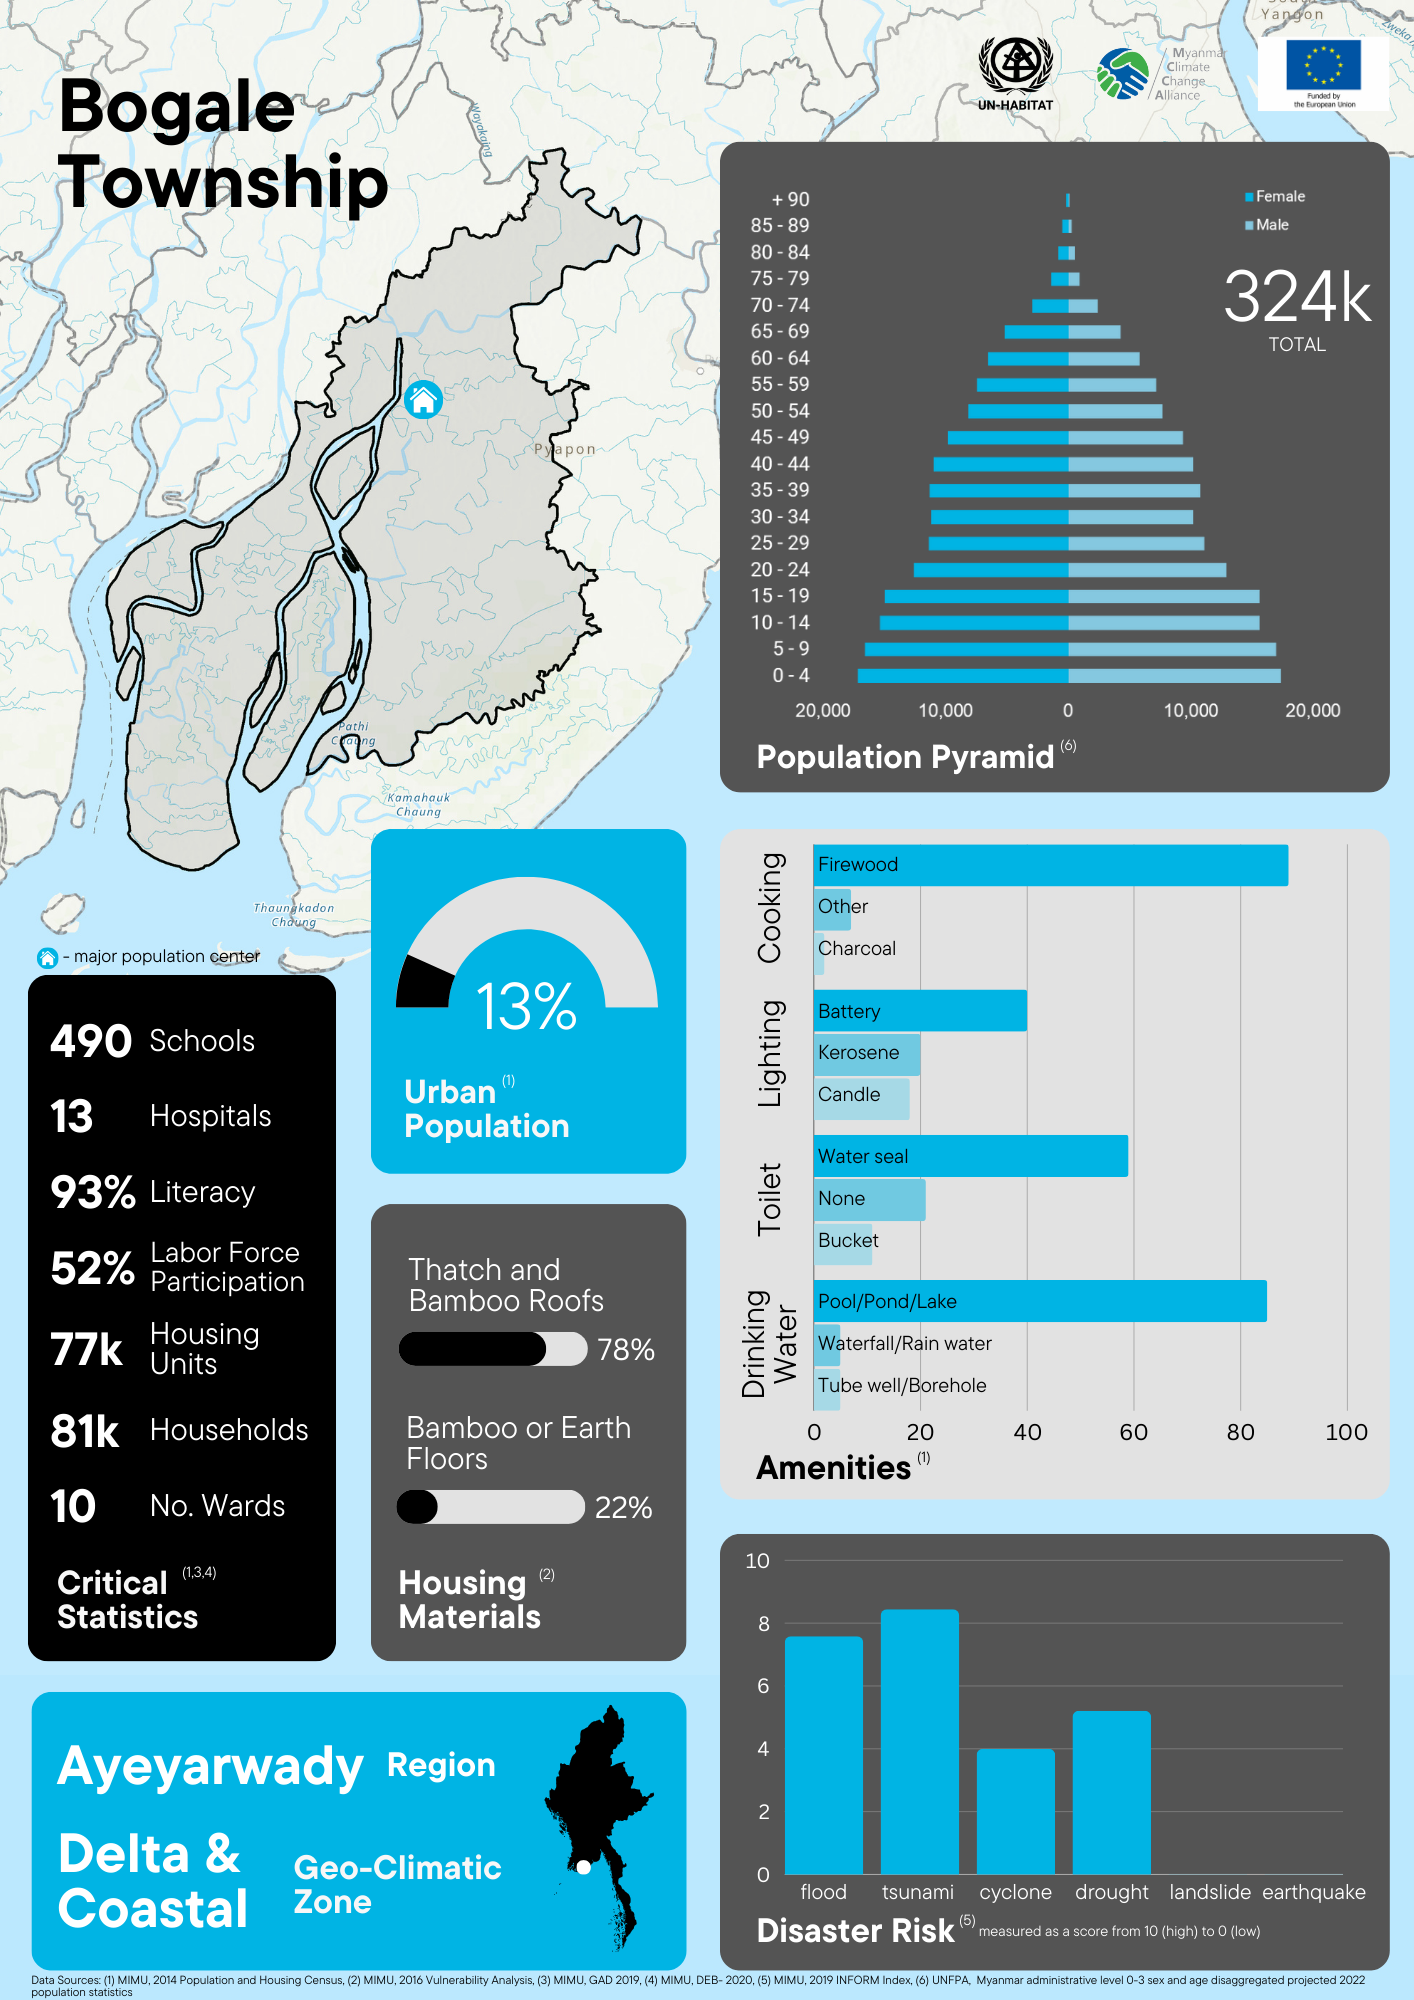
Above you can find an overview of general information about the township including statistics on demographics and access to various amenities. The following map additionally displays geo-spatial data from the township. Try turning on and off the different layers to explore more about the township!

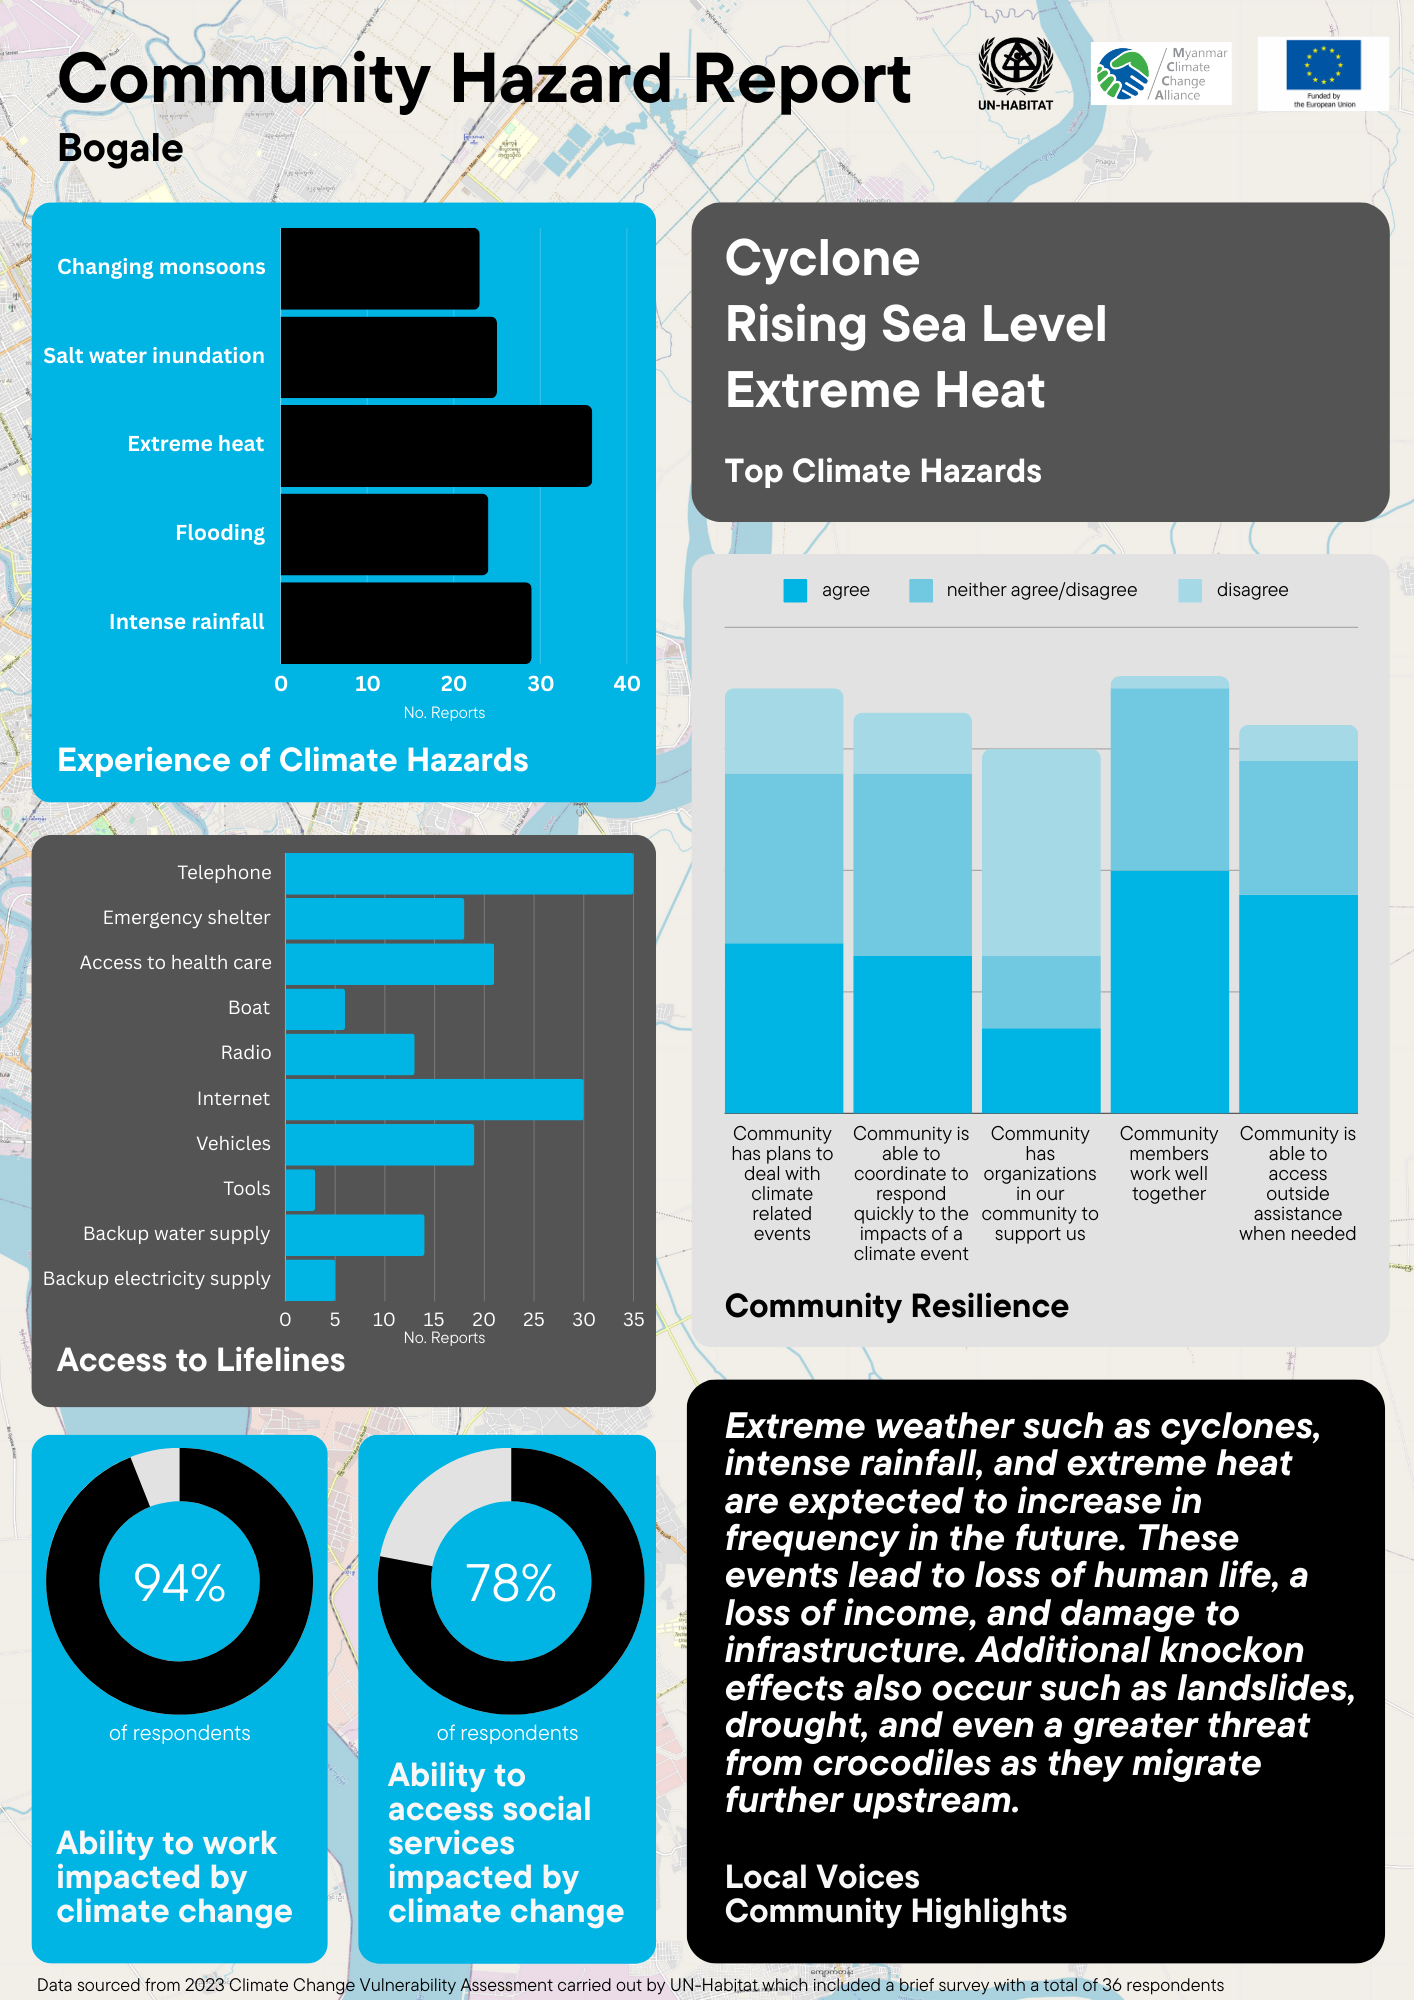
Above you can find highlights from the results of the Climate Change Vulnerability Assessment workshops such as which climate hazards the community is facing, how they perceive the impacts, and their coping capacity. The following map additionally displays the results of the community climate hazard mapping exercises. Try turning on and off different layers to explore where the community experiences each hazard!
Results coming soon!